Cross stitch guide
Making a pattern in a spreadsheet
A spreadsheet becomes a chart once its cells are square. Make the rows as tall as the columns are wide, fill one cell for each stitch, type a symbol in it, and draw a heavier border after every tenth cell. It works, but it takes many steps, and the pattern maker here is a grid already made for the job.
On this page 9 parts
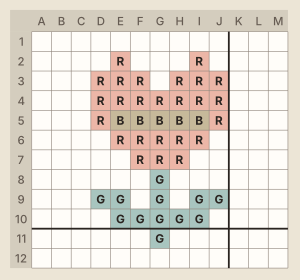
Step 1: make the cells square
A new sheet has wide, short cells. A chart needs squares.
- In Excel, the two measures use different units: a row's height is in points and a column's width is counted in characters. So the same number in both boxes does not give a square. Switch to Page Layout view (View, then Page Layout), where both can be typed in inches or centimeters. Select the whole sheet, then set the column width and the row height to the same measure. About 0.2 inch (0.5 cm) works well: that is as large as the squares get on this site's own printed charts.
- In Google Sheets, select the columns, right-click a column letter and choose "Resize column". Type a width. Then select the rows, right-click a row number, choose "Resize row" and type a height. Change one of the two numbers until the cells look square.
Decide the size of the chart now. Sixty columns and forty rows are a design 60 stitches wide and 40 high.
Step 2: fill one cell for each stitch
Select a cell, or drag across several, and give them a fill color from the fill color button on the toolbar. One filled cell is one cross stitch. An empty cell is bare cloth.
Start with something small, and with the outline of the shape, then fill it in.
Step 3: put a symbol in each color
A printed chart is read by symbol, not by color, so type one letter or mark into every filled cell: the same one for every cell of that color.
Typing the symbol first can save the coloring. Both programs have conditional formatting: a rule that colors a cell by what it holds. Make one rule for each symbol, such as "the cell is exactly R, so fill it red". Then you only type letters, and the colors follow.
Step 4: a heavier line every ten
Charts carry a heavier line after every tenth square, so that stitches can be counted in tens. Select the first ten columns and give the block a thick border on its right side with the borders button. Do the same for each block of ten columns, then for the rows, with a thick border along the bottom.
Step 5: write the key
Below the chart, list each symbol, a filled cell in its color, and the thread number you have chosen for it. A spreadsheet knows nothing about thread: you match each color to a real thread yourself.
It can count for you, though. The COUNTIF function counts the cells in a range that hold one symbol. That gives the number of stitches in each color.
Step 6: print it
- Select the chart and the key, and print only those cells.
- Use borders for the grid lines. Borders print wherever you put them. In Excel the sheet's own faint gridlines print only if you tick "Print" under Gridlines on the Page Layout tab, and then only around cells that hold something.
- A wide chart fits better on a page turned on its side (landscape).
- Shrinking a big chart to one page makes the symbols too small to read. Let it run over several pages.
What a spreadsheet cannot do
- It does not match colors to thread numbers.
- It has no thread list with stitch counts unless you build one.
- It does not repeat rows where pages join, or mark the center, unless you add them by hand.
The shorter way
The pattern maker on this site is a grid made for stitches. You draw with a finger or a mouse, pick threads from 388 DMC numbers, and "Download PDF" gives a chart with symbols, heavier lines at every ten, center marks, a thread key and the fabric size to cut. It is free and runs in your browser.
To draw by hand instead, print graph paper with the squares already ruled.
Where to go next
How to make a cross stitch pattern covers choosing the size, the fabric count and the colors, whichever grid you draw on.